If you want to know more about how the CVS detection will improve the diagnosis of MS, and what QMENTA can do about it, then this article might interest you.
In Multiple Sclerosis (MS), the McDonald diagnostic criteria (3) guides the clinical, radiographic, and laboratory diagnosis of MS. It was first introduced in 2001 and has undergone several revisions, with the most recent update in 2017 (4). A forthcoming 2024 update (5), pending formal publication, includes significant changes, notably the incorporation of the central vein sign (CVS) as an imaging marker in the diagnostic process. The CVS is a biomarker that can be detected with Magnetic Resonance Imaging (MRI). It has the potential to improve the accuracy and speed of diagnosing MS by reliably differentiating it from similar conditions (1)(2).
In 2012 Sati et al. developed the FLAIR* technique (6), a post-processing method combining two routine clinical MRI sequences, FLAIR and T2*. Compared to raw, direct-from-the-scanner images, the FLAIR* image proved useful for detecting the CVS because of its increased contrast between both white matter (WM) lesions and cerebral veins (7).
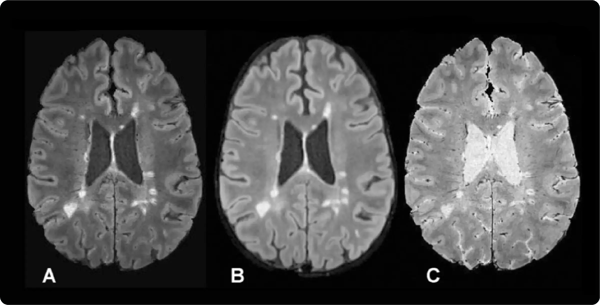
Figure 1: A, Axial FLAIR* image, B, axial T2-weighted FLAIR image, and, C, axial T2*-weighted segEPI image
An ongoing study conducted by the Cleveland Clinic (CAVS-MS) aims to test the reproducibility of the FLAIR* sequence in a multi-center and multi-vendor scenario and the use of the CVS as a diagnostic biomarker (8). Unfortunately, both computing the FLAIR* and detecting CVS are time-consuming processes. Image processing tasks are usually code scripts developed for specific computing environments which make them difficult to reproduce in other centers. Further, case report forms (CRFs) need to be completed usually by hand and then either physically stored or digitized as electronic Case Report Forms (eCRF).
In addition, neuroradiologists face several challenges when assessing the CVS. These include the lack of superimposed images (such as FLAIR* for simultaneously evaluating both lesions and veins), the absence of sequences optimized for enhanced contrast to improve the visibility of the CVS, and the lack of standardized imaging, viewing, and rating techniques. Additionally, each radiologist or rater may use different local software for viewing, leading to inconsistencies in the results.
Challenges are big in multi-site settings: Data is scattered and there is lack of centralization, collaboration and information sharing between sites creates a complex compliance management framework, and it is difficult to organize data for longitudinal analysis.
CAVS-MS Project in the QMENTA Platform
In order to avoid the aforementioned pain points, a partnership with QMENTA was agreed. The study involves 12 different sites with more than a 100 users in total. To address the complexity of the project at hand, QMENTA provides a powerful data management system to facilitate compliant data access management. The QMENTA Platform stores imaging series, metadata and analyses results for the same study in a role-based access system called project. Each participant is assigned a specific role in the Platform’s project based on their site affiliation. This role assignment streamlines operations while enhancing security: for instance, project managers have full access to all project data, while site users can only share and manage data related to their own site, without visibility into data from other sites.
QMENTA's expert team has successfully created 23 customized eCRF to be used throughout the study to collect information about the subject’s enrollment, demographics, eligibility, medical history, neuro-QoL, diagnosis reviews, etc. These forms were thoroughly tested and validated together with the Cleveland Clinic to ensure seamless usability. Filled-in forms are safely stored in the cloud and immediately available for revision and approval by stakeholders who have the required permissions.
 Figure 2: An eCRF form example in the QMENTA Platform.
The study process is organized with each subject's data arranged in rows, while the "Visit's Progress" and "Forms Completed" columns provide key insights into their status. The number of forms completed are counted at subject level, including all visits. A quick glance allows verification of which visits are completed and which are still ongoing.
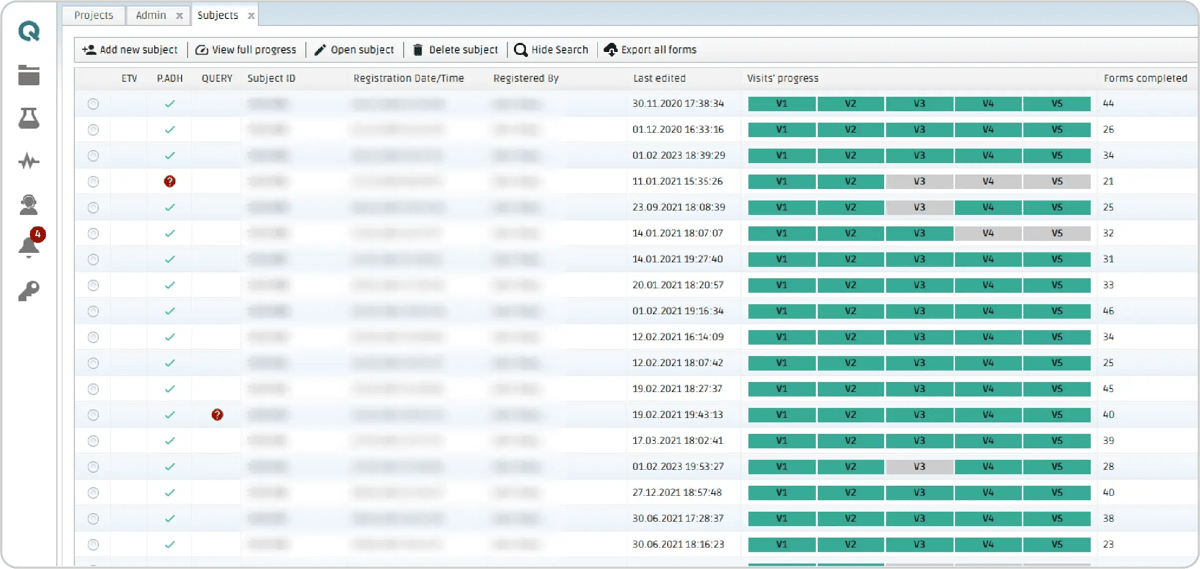
Figure 3: Subject table in the CAVS-MS project in the QMENTA Platform. The submitted and approved visits with no pending queries are marked in green and ongoing visits are marked in yellow. The Protocol Adherence column (P. ADH) indicates the result of the protocol adherence module. More information about the protocol adherence results can be found in the MRI Files form.
 Figure 4: Forms pertaining to a visit can be checked using the dropdown menu

Figure 5: In the visit view, all the forms can be accessed and edited by clicking on the Open/edit for button.
In this particular study, the first (V1) and fifth (V5) visits also include MRI data. All MRI series from an acquisition session need to be zipped, uploaded to the Platform by means of a user-friendly interface, and, within minutes, the scans appear classified and labeled with accurate tagging in the “MRI files form”. Additionally, a protocol-adherence tool ensures that the uploaded data aligns with the study's specific criteria. Information about the imaging acquisition should be written in the project’s protocol rules which are compared against the uploaded files settings, verifying full compliance with the study's requirements for seamless data management. An icon will appear on the left of the subject’s ID indicating that the protocol adherence has been processed successfully with a green tick or not with a red question mark. All this process is done automatically, no manual intervention is required.
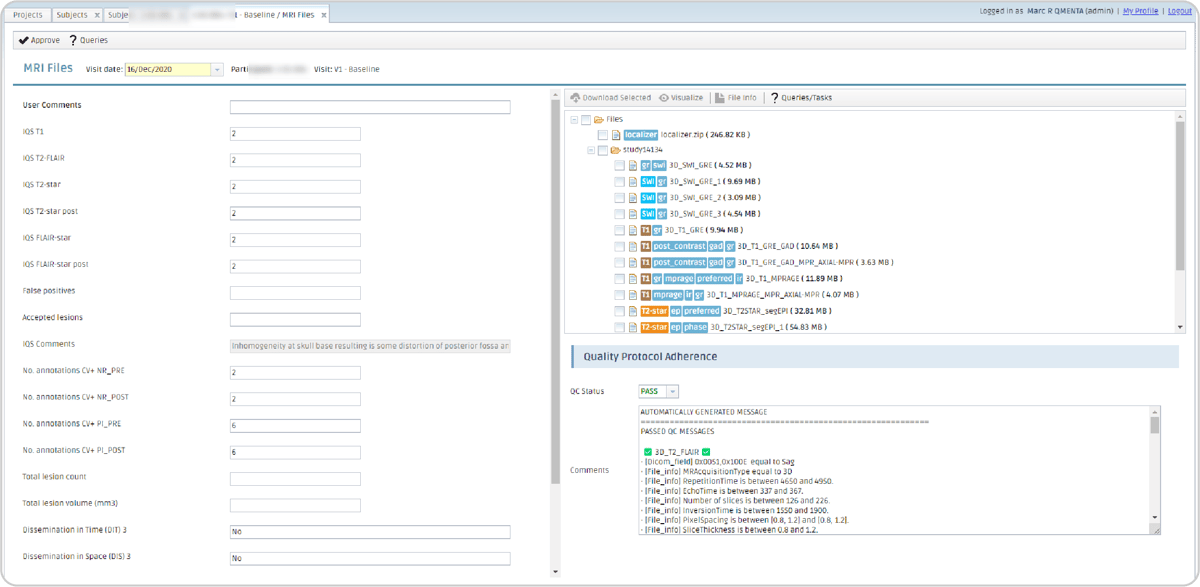
Figure 6: MRI form displaying the metadata linked to analyses run with this dataset as input (left); the uploaded dataset labeled by the automatic classification upon upload (top-right); and the protocol adherence tool's rules and status (bottom-right).
The CAVS-MS Workflow
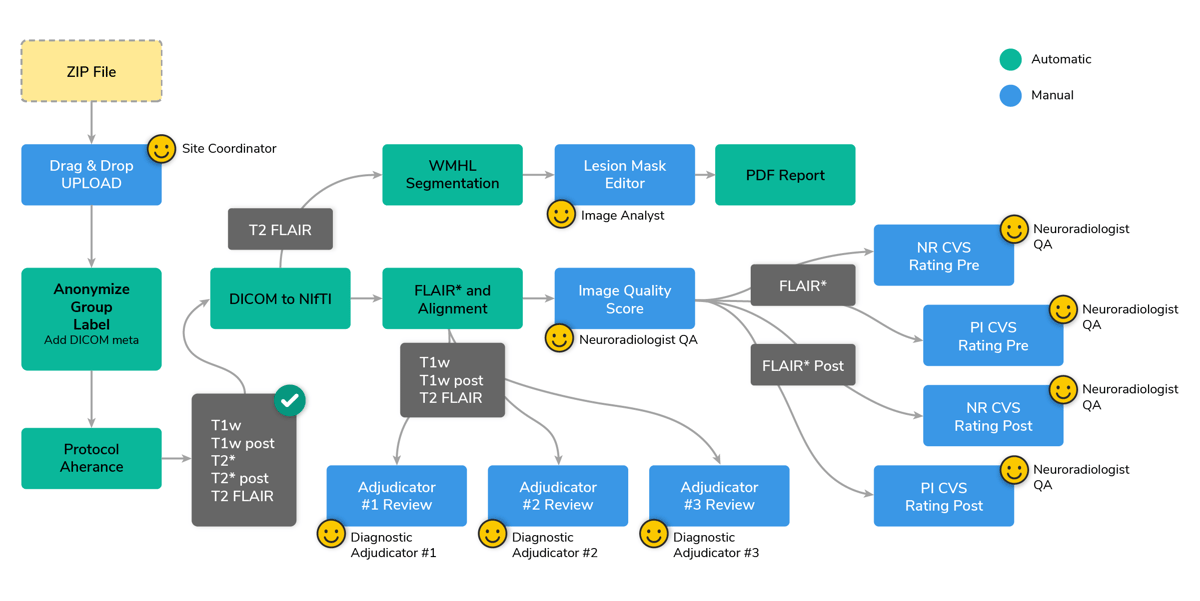
A streamlined workflow was developed to automate the production of the FLAIR* image and expedite CVS detection using a semi-automated pipeline. The process initiates if the protocol adherence module successfully validates the data. Next, a module converts all DICOM series to NIfTI. Following that, the NIfTI files are aligned to the MNI space and pre- and post-contrast FLAIR* images are generated. A manual image quality check requires a neuroradiologist to confirm the data's suitability for CVS detection.
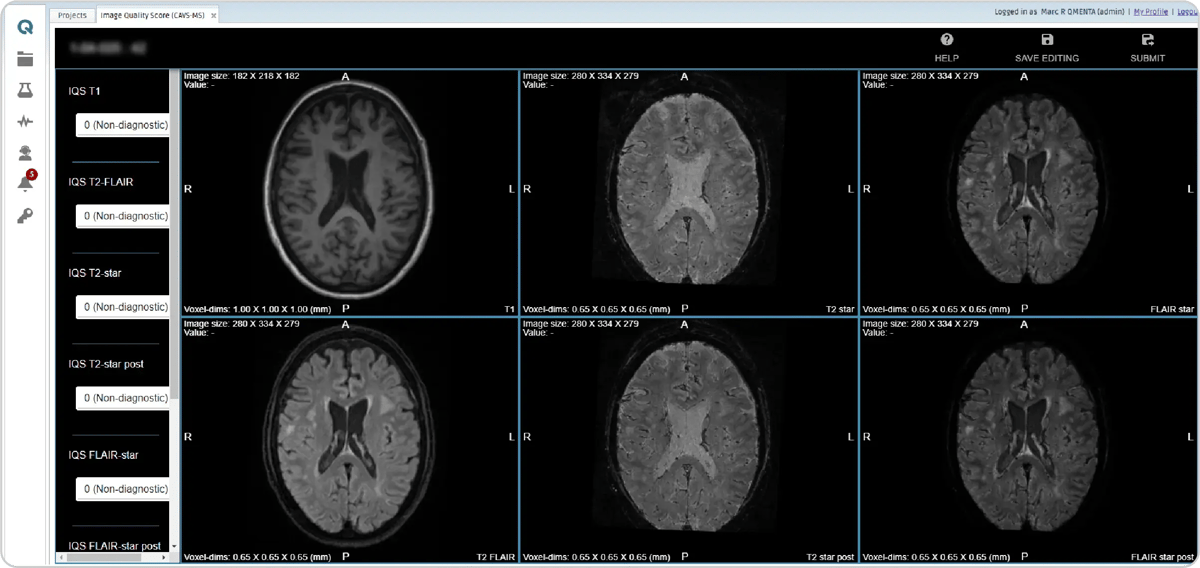
Figure 8: Image quality is verified by scoring the files using “0 (Non-diagnostic)”, “1 (Satisfactory)”, and “2 (Excellent).
In parallel, an AI-powered lesion (9) segmentation module creates a white matter hyperintensity lesion mask, which is refined by an image analyst using an intuitive online editor.
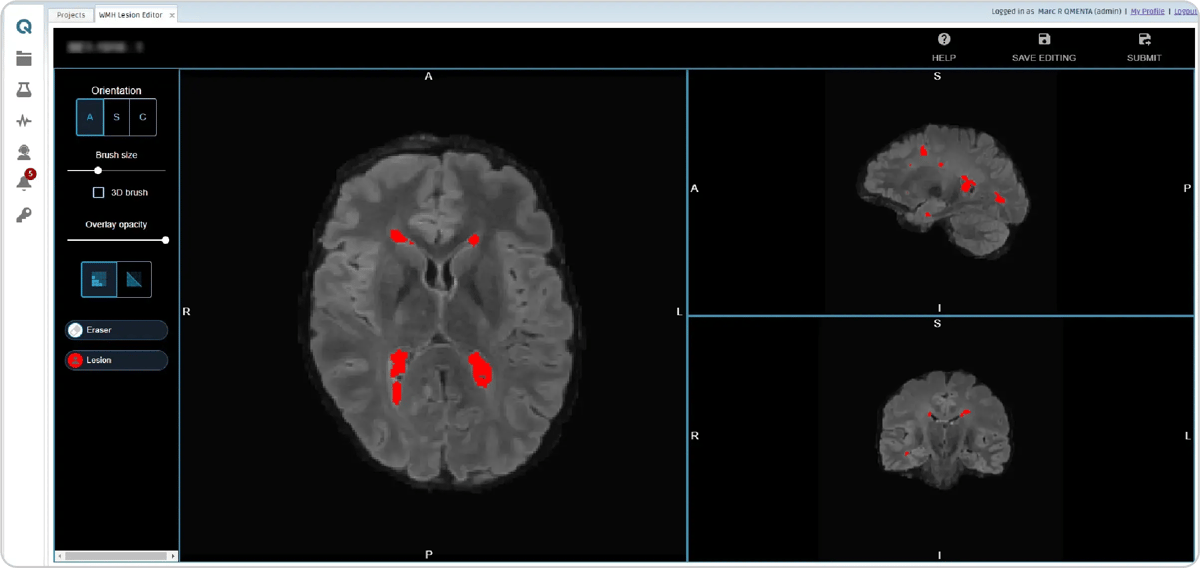
Figure 9: Lesion mask editor module.
Three distinct manual review modules allow adjudicators to assess the presence of dissemination in space or time in the images.
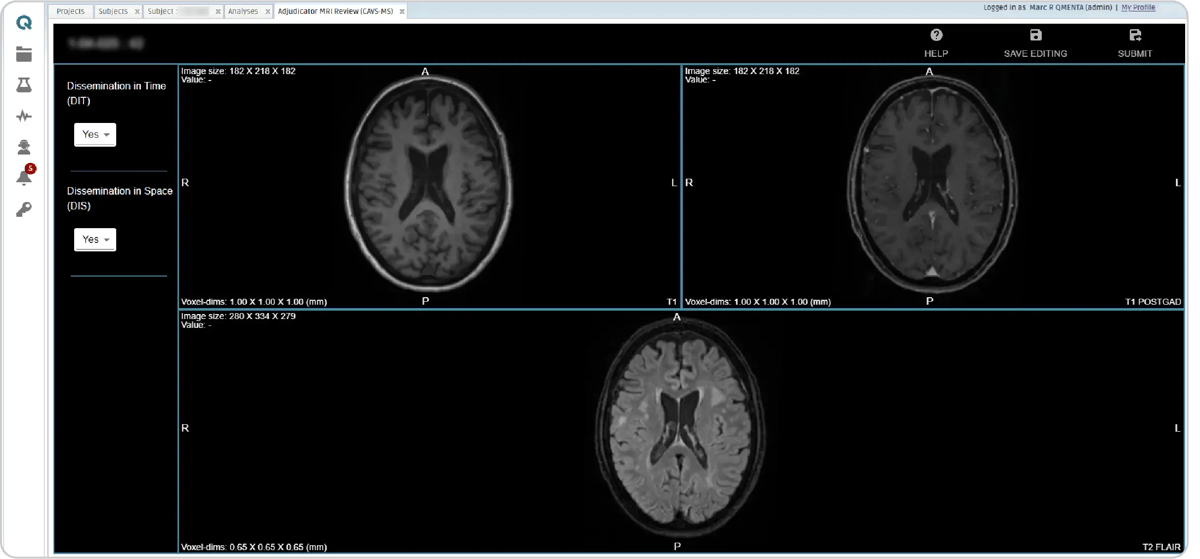
Figure 10: Diagnostic adjudicator review module.
Following these, four CVS detection modules are triggered, two for detecting CVS in pre-contrast FLAIR* images and two for post-contrast FLAIR* images. The identification of the central vein is done by a radiologist quality analyst with a marker, which creates a new element on the list on the left side (see CVS step, figure 10), including its coordinates. After scrolling to search for other CVS, already marked CVS can be clicked on the list and to go back to that particular CVS.
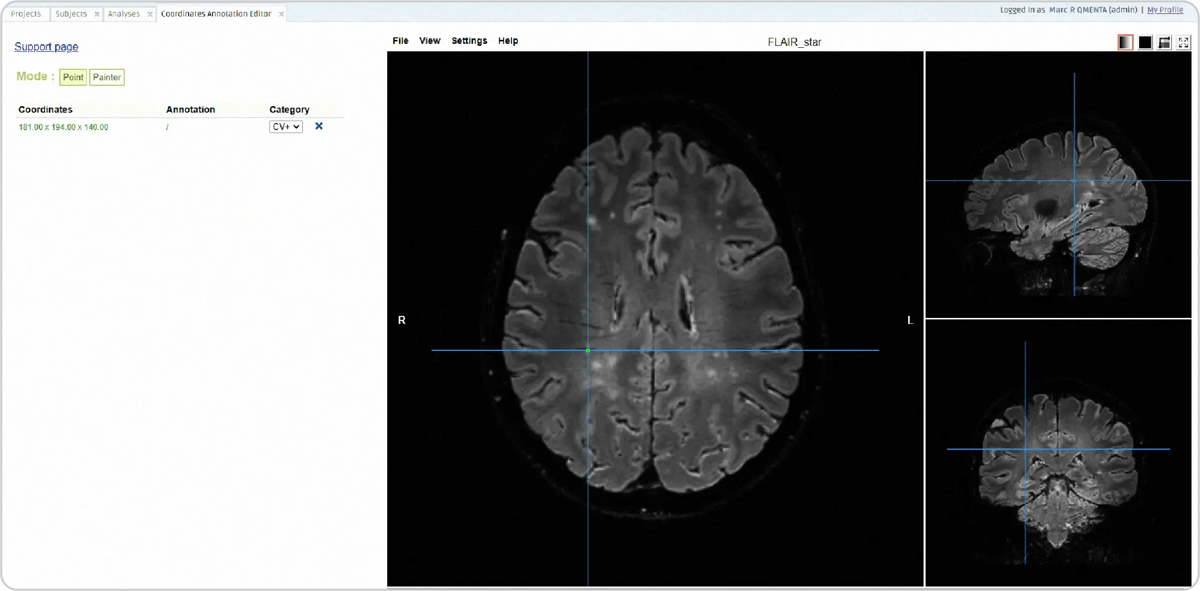
Figure 11: The CVS step in the workflow to identify and mark the CVS
The answers given in the manual steps are saved in the MRI Form as metadata which can be exported from the QMENTA Platform to perform advanced statistics or reporting. Lesion count and lesion volume are computed after the lesion mask editing and are also kept in the session’s metadata inside the MRI files form.
Read more about the CAVS-MS workflow in our blog “Central Vein Sign: A Breakthrough in Multiple Sclerosis Diagnosis, Redefining McDonald Criteria” and in our tools catalog Central Vein Sign Detection Workflow.
The CVS is a groundbreaking MRI biomarker that is transforming the diagnosis of MS by effectively distinguishing it from similar conditions while not being invasive. As part of the upcoming 2024 update to the McDonald diagnostic criteria, the inclusion of CVS promises to enhance accuracy and speed in MS diagnosis. Leveraging cloud-based infrastructure and scalable processing power, seamless data management and image analysis become a reality. Plus, with customizable role assignments and per-site permissions, QMENTA provides an efficient, compliant, and highly collaborative environment tailored to meet local regulations. Unlock the potential of CVS detection today and drive faster, more reliable outcomes!
References
- Central vein sign: A diagnostic biomarker in multiple sclerosis (CAVS-MS) study protocol for a prospective multicenter trial
- "Central vessel sign" on 3T FLAIR* MRI for the differentiation of multiple sclerosis from migraine
- Recommended diagnostic criteria for multiple sclerosis: Guidelines from the international panel on the diagnosis of multiple sclerosis - McDonald - 2001 - Annals of Neurology - Wiley Online Library
- Diagnosis of multiple sclerosis: 2017 revisions of the McDonald criteria - PubMed
- McDonald Criteria Updates for MS Diagnosis Announced - Practical Neurology
- FLAIR*: A Combined MR Contrast Technique for Visualizing White Matter Lesions and Parenchymal Veins - PMC
- FLAIR* to visualize veins in white matter lesions: A new tool for the diagnosis of multiple sclerosis? | European Radiology
- Central vein sign: A diagnostic biomarker in multiple sclerosis (CAVS-MS) study protocol for a prospective multicenter trial - ScienceDirect
- Multiple Sclerosis Lesion Segmentation using Improved Convolutional Neural Networks
