Research into brain asymmetry has long held the fascination of neuroscientists and psychologists. Findings have associated it with a wide range of aspects from cognitive abilities to psychiatric disorders [1,2]. A central challenge has been accurately measuring this asymmetry, leading us to develop a comprehensive workflow. In this blog, we will explore structural and functional asymmetry, along with the methods used to measure them and introduce our novel workflow. Let's begin by diving into structural asymmetry.
Structural asymmetry
Structural asymmetry in the brain refers to the differences in size, shape, connectivity, or any other morphological features between corresponding regions of the left and right hemispheres. In this context, connectivity refers to the physical connections between different brain regions, such as the axons and dendrites that link neurons together. Such asymmetries can be seen at various scales and can encompass differences in the size of particular regions, differences in the thickness of the cortex, or even differences at the microscopic level [3].
Probing structural asymmetry in the human brain can be done through various MRI techniques, including Diffusion Tensor Imaging (DTI) for white matter tract integrity, Voxel-Based Morphometry (VBM) for local gray matter concentration, and Surface-Based Morphometry (SBM) for cortical surface properties [4], [5].
While these techniques offer remarkable insights into brain structure, they are not without limitations. One notable concern is the user-friendliness of existing software used for data processing and analysis. It suffers from a high degree of complexity and it requires multiple software packages for the different analysis stages.
We address these limitations in our workflow by bundling together several preprocessing and analysis steps. This allows for a more user-friendly approach to brain asymmetry analysis.
Functional asymmetry
Functional magnetic resonance imaging (fMRI) is a non-invasive imaging technique used to detect and map the changes in blood oxygenation in the brain that correlate with neuronal activity. When neurons are active, they consume more oxygen, leading to changes in blood flow. The fMRI measures these changes, known as blood-oxygen-level dependent (BOLD) contrasts, to produce activation maps showing which parts of the brain are involved in a particular mental process [6].
Functional connectivity refers to the statistical dependencies or correlations between spatially remote neurophysiological events. Essentially, it describes how different regions of the brain communicate or work together in a synchronized way, with or without direct anatomical connections [7]. Functional asymmetry is then an asymmetry between this functional connectivity in both brain hemispheres.
Seed-based functional connectivity is a common method used to explore how different regions of the brain interact with a specific area of interest, known as the "seed" region. In this analysis, researchers select a seed region and extract its time course of activity from the fMRI data. They then correlate this time course with the time courses from all other brain regions to create a connectivity map. This map highlights areas that are functionally connected to the seed region.
In addition to looking at the correlation between regions, it's also possible to do a graph-based analysis. Graph-based analysis uses nodes to represent different brain regions and edges to represent the connections or interactions between these regions, based on correlations in fMRI data. Graph-based analysis has been used for a myriad of research applications. For example, researchers discovered that graph-based measures can be used to identify alterations in brain networks in Alzheimer’s disease, schizophrenia and autism [8]. In addition, discoveries on brain organization and the aging of the brain have been made through graph-based analysis as well [9–11]. There is still more to discover about graph-based analysis, and the potential for biomarker development has been shown in Rubinov and Spoorns [12].
To aid in brain asymmetry research we developed a workflow to accommodate both graph-based and volumetric and functional asymmetry analysis.
Asymmetry Workflow
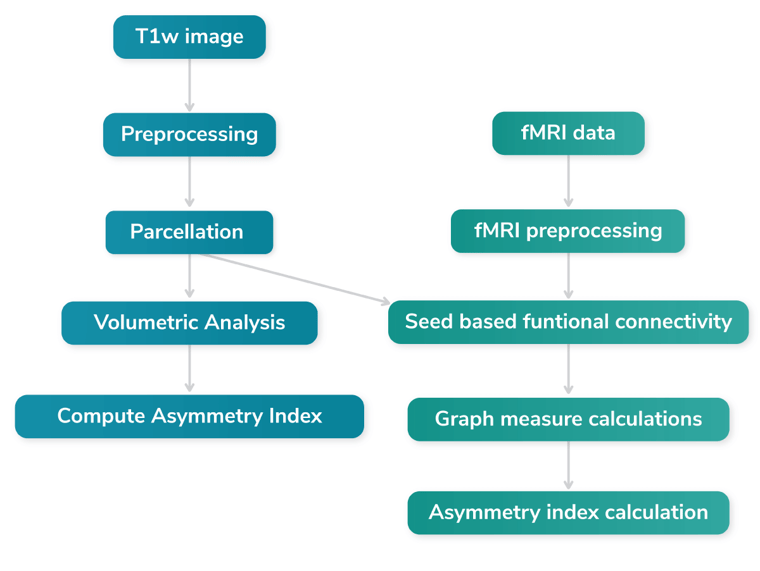
The image below illustrates our novel workflow consisting of the following steps:
- Input: T1w and fMRI images.
- T1w Preprocessing: The data undergoes various preprocessing steps, such as motion correction and skull stripping.
- Parcelation and Volumetric Statistics: T1w image is parcellated using the DKT atlas from FreeSurfer [14].
- Asymmetry Index Computation for volumetric data.
Next we go to the fMRI processing pipeline:
- fMRI Processing: fMRI data is processed using fmriprep [13].
- Seed-based Connectivity, calculation of the functuinal connectivity using the DKT parcellation i.e. building the connectivity matrix.
- Graph Measure Calculations: Computing the grapth measures from the connectivity matrix
- Asymmetry Index Computation: Finally, the asymmetry index is computed for both the FreeSurfer analysis outcome and the graph measures outcome.

The steps in green are discussed in the functional asymmetry section and the steps in blue in the structural asymmetry section.
Conclusion
The study of brain asymmetry, encompassing structural and functional aspects, provides valuable insights into the complex nature of the human brain. This blog has highlighted both the challenges and opportunities in current methodologies, from techniques such as Voxel-based morphometry to the application of graph-based analysis to fMRI data.
Our newly developed workflow addresses existing limitations by offering a more user-friendly, unified approach to brain asymmetry analysis. This tool provides a framework for investigating asymmetry indices as potential biomarkers. It also supports research into psychiatric disorders and broadens our understanding of neurodevelopmental studies.

References:
[1] S. J. Gotts, H. J. Jo, G. L. Wallace, Z. S. Saad, R. W. Cox, and A. Martin, “Two distinct forms of functional lateralization in the human brain,” Proc. Natl. Acad. Sci., vol. 110, no. 36, pp. E3435–E3444, Sep. 2013, doi: 10.1073/pnas.1302581110.
[2] T. Guadalupe et al., “Human subcortical brain asymmetries in 15,847 people worldwide reveal effects of age and sex,” Brain Imaging Behav., vol. 11, no. 5, pp. 1497–1514, Oct. 2017, doi: 10.1007/s11682-016-9629-z.
[3] A. W. Toga and P. M. Thompson, “Mapping brain asymmetry,” Nat. Rev. Neurosci., vol. 4, no. 1, Art. no. 1, Jan. 2003, doi: 10.1038/nrn1009.
[4] J. Ashburner and K. J. Friston, “Voxel-Based Morphometry—The Methods,” NeuroImage, vol. 11, no. 6, pp. 805–821, Jun. 2000, doi: 10.1006/nimg.2000.0582.
[5] D. Le Bihan et al., “Diffusion tensor imaging: concepts and applications,” J. Magn. Reson. Imaging JMRI, vol. 13, no. 4, pp. 534–546, Apr. 2001, doi: 10.1002/jmri.1076.
[6] S. Ogawa, T. M. Lee, A. R. Kay, and D. W. Tank, “Brain magnetic resonance imaging with contrast dependent on blood oxygenation.,” Proc. Natl. Acad. Sci. U. S. A., vol. 87, no. 24, pp. 9868–9872, Dec. 1990.
[7] M. Greicius, “Resting-state functional connectivity in neuropsychiatric disorders,” Curr. Opin. Neurol., vol. 21, no. 4, p. 424, Aug. 2008, doi: 10.1097/WCO.0b013e328306f2c5.
[8] “Altered Small-World Brain Networks in Temporal Lobe in Patients with Schizophrenia Performing an Auditory Oddball Task - PMC.” https://www.ncbi.nlm.nih.gov/pmc/articles/PMC3037777/ (accessed Aug. 07, 2023).
[9] D. S. Bassett and E. Bullmore, “Small-world brain networks,” Neurosci. Rev. J. Bringing Neurobiol. Neurol. Psychiatry, vol. 12, no. 6, pp. 512–523, Dec. 2006, doi: 10.1177/1073858406293182.
[10] R. F. Betzel, L. Byrge, Y. He, J. Goñi, X.-N. Zuo, and O. Sporns, “Changes in structural and functional connectivity among resting-state networks across the human lifespan,” NeuroImage, vol. 102 Pt 2, pp. 345–357, Nov. 2014, doi: 10.1016/j.neuroimage.2014.07.067.
[11] M. P. van den Heuvel, R. C. W. Mandl, R. S. Kahn, and H. E. Hulshoff Pol, “Functionally linked resting-state networks reflect the underlying structural connectivity architecture of the human brain,” Hum. Brain Mapp., vol. 30, no. 10, pp. 3127–3141, Oct. 2009, doi: 10.1002/hbm.20737.
[12] M. Rubinov and O. Sporns, “Complex network measures of brain connectivity: Uses and interpretations,” NeuroImage, vol. 52, no. 3, pp. 1059–1069, Sep. 2010, doi: 10.1016/j.neuroimage.2009.10.003.
[13] O. Esteban et al., “fMRIPrep: a robust preprocessing pipeline for functional MRI,” Nat. Methods, vol. 16, no. 1, Art. no. 1, Jan. 2019, doi: 10.1038/s41592-018-0235-4.
[14] B. Fischl, “FreeSurfer,” NeuroImage, vol. 62, no. 2, pp. 774–781, Aug. 2012, doi: 10.1016/j.neuroimage.2012.01.021.
